
Posted by
Rank Ranger
If you follow PPC industry news, you may have noticed that Bing has been making a constant stream of changes to its ad management abilities. In fact, Bing has worked hard to ensure that you can easily import your AdWords ads into its platform. Seeing this, we thought it would be not only nifty, but impactful to see your Bing Ads performance alongside that of your AdWords campaigns. As such, we’re announcing that you can now integrate your Bing Ads data into Rank Ranger. The upshot, (other than being able to access all of your data in one place and sharing it within white label reports) is that you can plot your Bing Ads and AdWords data together on our custom graphs or within the same series of widgets. Here’s how to do it.
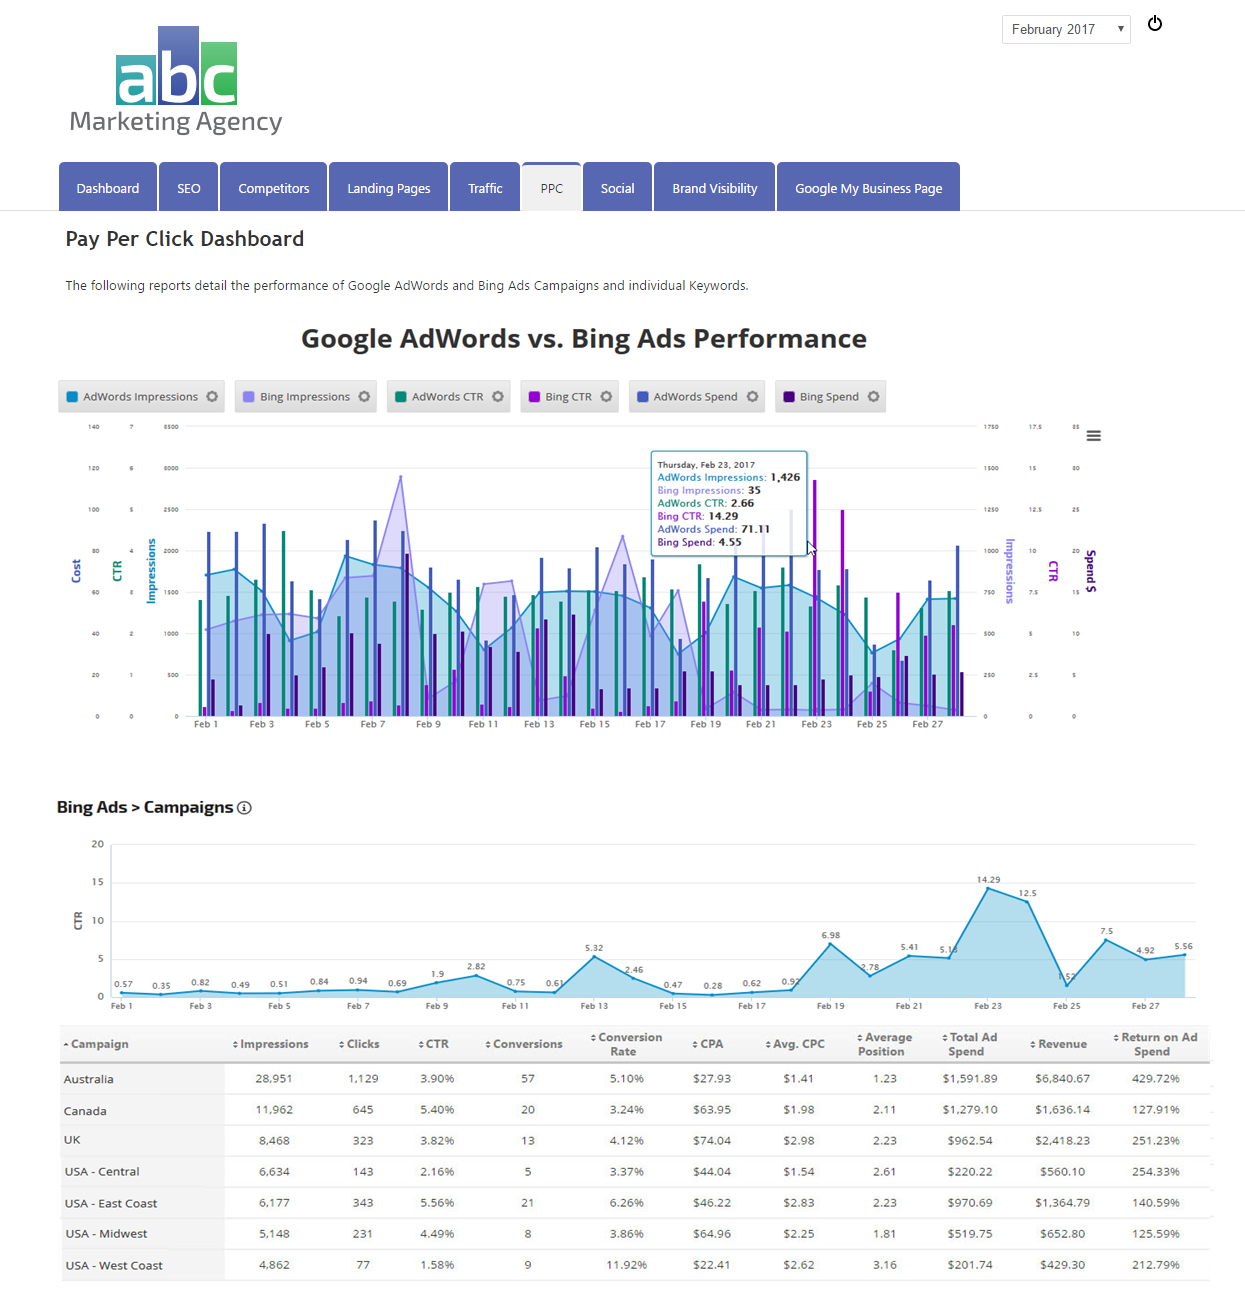
What Bing Ads Data Can You See?
Let’s start with what you can see within the Bing Ads PPC reports we’ve created and work our way towards how you can use the data to highlight performance via a direct comparison to AdWords. We’ve set up three reports that work in a tiered fashion, moving from the campaign to keyword level, in order present you with a comprehensive and customizable look at your Bing Ads data.
Bing Ads Campaigns PPC Performance Report
Offering you a “wide-angle” view of your Bing Ads, the Bing Ads Campaigns Performance report presents aggregate, campaign-level data insights. True to form, the PPC report offers you both a graphic as well as a numeric look at your ad campaigns. To this extent, you can set a top graph to show Bing Ads campaign data related to Clicks, Impressions, CTR, and Spend.

The Performance Graph as seen on the Bing Ads Campaigns Performance report
The key metric Performance Graph within the report is accompanied by a table that indicates a per campaign breakdown of the following metrics:
- Avg. CPC (Average Cost per Click): The total cost of all clicks divided by the total number of clicks
- Average Position: The average position of the campaign’s ads on the SERP
- Clicks: The number of clicks on your Bing ads triggered by each keyword
- CTR (Click Through Rate): The percentage of times users clicked on your ads when they were displayed on the SERP (calculated as clicks divided by impressions)
- Conversions: The total number of conversions resulting from clicks on ads triggered by keyword
- Conversion Rate: The number of conversions divided by the total number of clicks
- CPA (Cost per Action): Total cost divided by the number of conversions
- Impressions: The number of times your Bing ads were displayed on Bing SERPs
- Match Type: Column showing the keyword match type in Bing Ads (Exact, Phrase or Broad)
- Return on Ad Spend: Revenue divided by spend, expressed as a percentage
- Revenue: Total revenue from conversions (revenue per-conversion times the number of conversions, calculated using a per-conversion revenue amount provided by the administrator)
- Spend: Total cost of the clicks for each keyword
- Status: Column showing the ad group’s status in Bing Ads (Enabled or Disabled)
- Total Ad Spend: The total cost of all clicks

The Ads Metrics table within the Bing Ads Campaigns Performance report
Of course, you have the option to show data for any and all of your Bing Ads campaigns, and can custom select which campaigns you would like to display on the report at any given time.
Bing Ad Groups PPC Performance Report
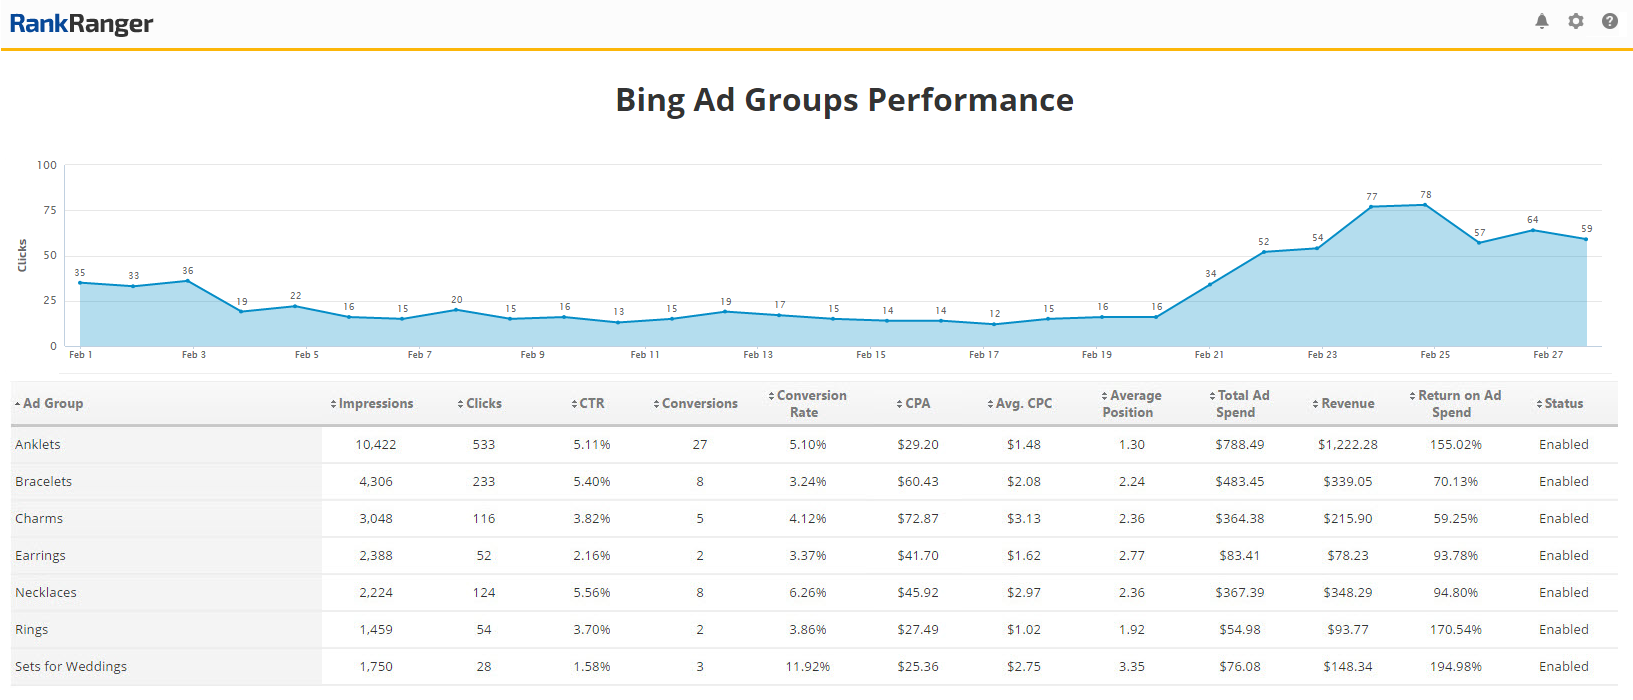
The Bing Ad Groups report with a Performance Graph key metric set to show CTR data
Filtering down to the next level, the Bing Ad Groups report highlights per grouping data across your Bing Ads campaigns. With perfect logic, you can of course select not only which ad groups to display, but which of your ad campaigns should be represented as well.
As with the Bing Ads Campaigns Performance report, a key metric graph is available to be displayed over a numeric table. Like the top graph within the campaign level report, you can choose to display either Impressions, CTR, and Spend here as well.
The accenting chart offers you access to the full list of metrics that were made available to you within the Campaigns Performance report, but does so on a per ad group basis (as opposed to per campaign).
Bing Ads Keyword PPC Performance Report
Finally, and representing the most specific tier of your Bing Ads data, the Bing Ads Keywords Performance report offers insights into your Bing PPC performance at the keyword level. As with the two previous reports, you have the option to display a graph indicating either Impressions, CTR, and Spend, however on a per keyword basis.
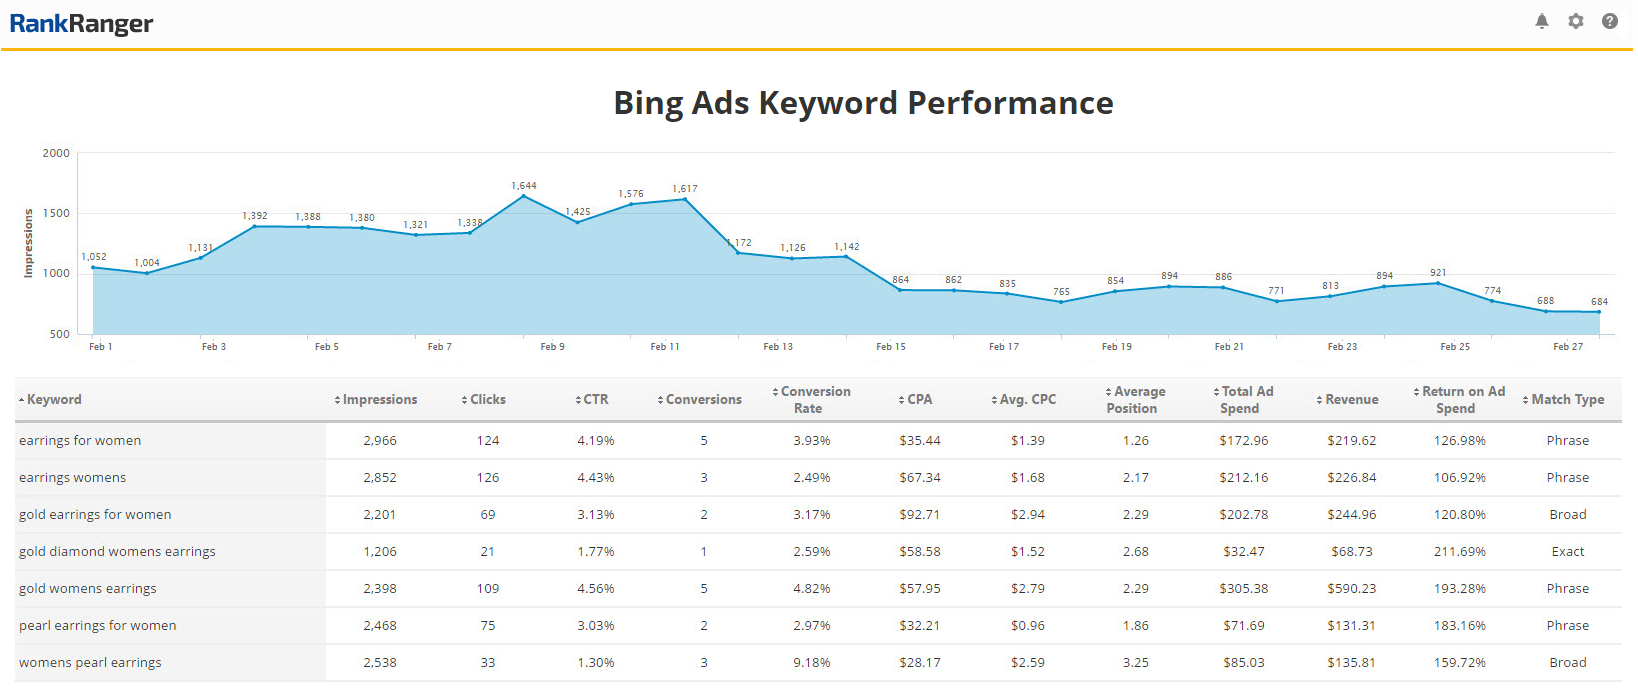
Data from the Bing Ads Keyword Performance report with Impressions showing in the Performance Graph
Here too, a full set of metric data is available within the report’s table where you can see each of your keyword’s Impressions, Clicks, CTR, Conversions, Conversion Rate, CPA, Average CPC, Average Position, Total Ad Spend
Revenue, Return on Ad Spend, and Match Type. As with the Bing Ad Groups report, you can choose which ad campaigns should have keywords represented within the data being displayed.
Bing Ads Report Options
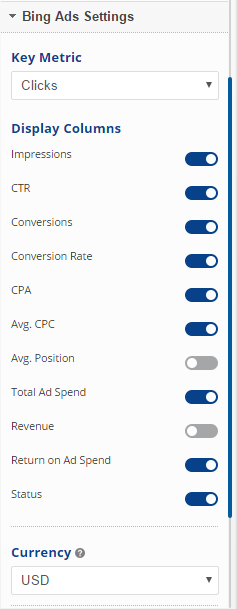
Per our mantra, the reports within our Bing Ads integration come equipped with an abundance of customization options. This
Within each section of the reports, the metrics you wish to show are totally at your disposal. Within the Performance Graph of each report you can choose the desired key metric from a drop-down menu. On the Metric Tables themselves, with the quick click of a toggle button, you can choose precisely which metrics you want displayed. Since this is ad reporting, you can also select the currency with which to present your data and as previously mentioned you can also select which ad campaigns you want included within a report’s presentation.
Simply speaking, how you want your Bing Ads data shown, what data you want to show, and for what period of time, is totally up to you to decide per your needs.
How to Compare Your Bing Ads and AdWords PPC Performance
Turning to the heart of the issue, by providing a Bing Ads integration we concurrently provide you with a way to create a direct comparison with AdWords. This goes beyond having access to both sets of PPC reporting data, but rather refers to an ability to plot both sets of data on the very same graph or within the same series of widgets. As a result, you can show a direct and immediate PPC performance comparison, allowing you to make smarter and more well-informed advertising decisions. So how exactly does this work?
Bing Ads and AdWords Comparative Data on the Insight Graph
Essentially, we built analogous reports for both Bing Ads and AdWords. Meaning, just as there is a campaign level, group level, and keyword level report for your Bing Ads, the same exists for your AdWords data. This paves the way for plotting both sets of data together on our Insight Graph. By setting up metrics for corresponding Bing Ads and AdWords on the Insight Graph, you are afforded with an easy way to see and compare trends and statistics for both data sets. Further, by setting up the same metrics, but for an earlier data range, not only can you directly compare Bing Ads to AdWords, but can do so against previous period performance as well.
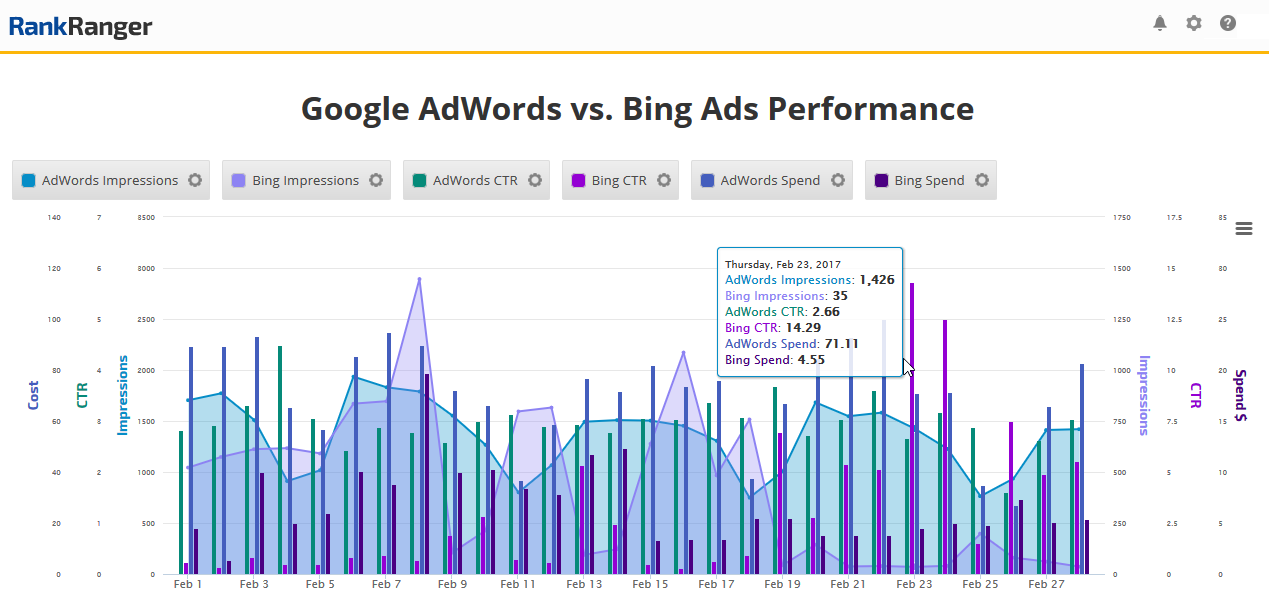
The Insight Graph showing blended metric data that offers a direct comparison between Bing Ads and AdWords performance
Bing Ads and AdWords Comparative Data with Metric Widgets
The second way you can create a direct comparison between Bing Ads and AdWords performance is via a series of Metric Widgets. Here, you can create a series of widgets, with each widget showing a specific Bing Ads or AdWords metric. The advantage here comes in showing a high volume of metric data. The Metric Widgets come equipped with the ability to create multiple rows of widgets partitioned by a title ready separator. The result, you can create row after row of widgets, each row highlighting alternating segments of your Bing Ads and AdWords data.
Simply, with the widgets, you could present a series of widgets depicting your campaign level Bing Ads data, followed by a row of campaign level AdWords data, subsequently followed by a row of widgets displaying group level Bing Ads data, and so forth, and so forth! (All of which may be too much data to show on one graph).

A series of Metric Widgets placing Bing Ads metrics directly against AdWords metrics for a unique data comparison
Reporting Your Bing Ad Performance Data
Deep Bing Ads PPC insights that can be shown against AdWords performance is something that you are going to want to share, whether internally, or externally to clients. What’s the point of having access to unique data formats that cannot be found anywhere else on the market if you can’t share it in a compelling manner?
We would as such be remiss if we did not mention that you can show your Bing Ads data, or your Bing Ads performance as compared to AdWords, within a series of white label reporting options. These abilities include automated PDF reports, the online and active data Client Dashboard, as well as, and most notably, the 100% white label Marketing Dashboard. With the Marketing Dashboard you have full access to the HTML and CSS, giving you the ability to make the dashboard look and feel like any site. Additionally, you can embed custom content right into the dashboard.
This is particularly pertinent for PPC managers who live an ever-changing advertising environment. With the Marketing Dashboard’s abilities, you can show industry news related to your PPC campaigns right there with your Bing Ads and AdWords data.
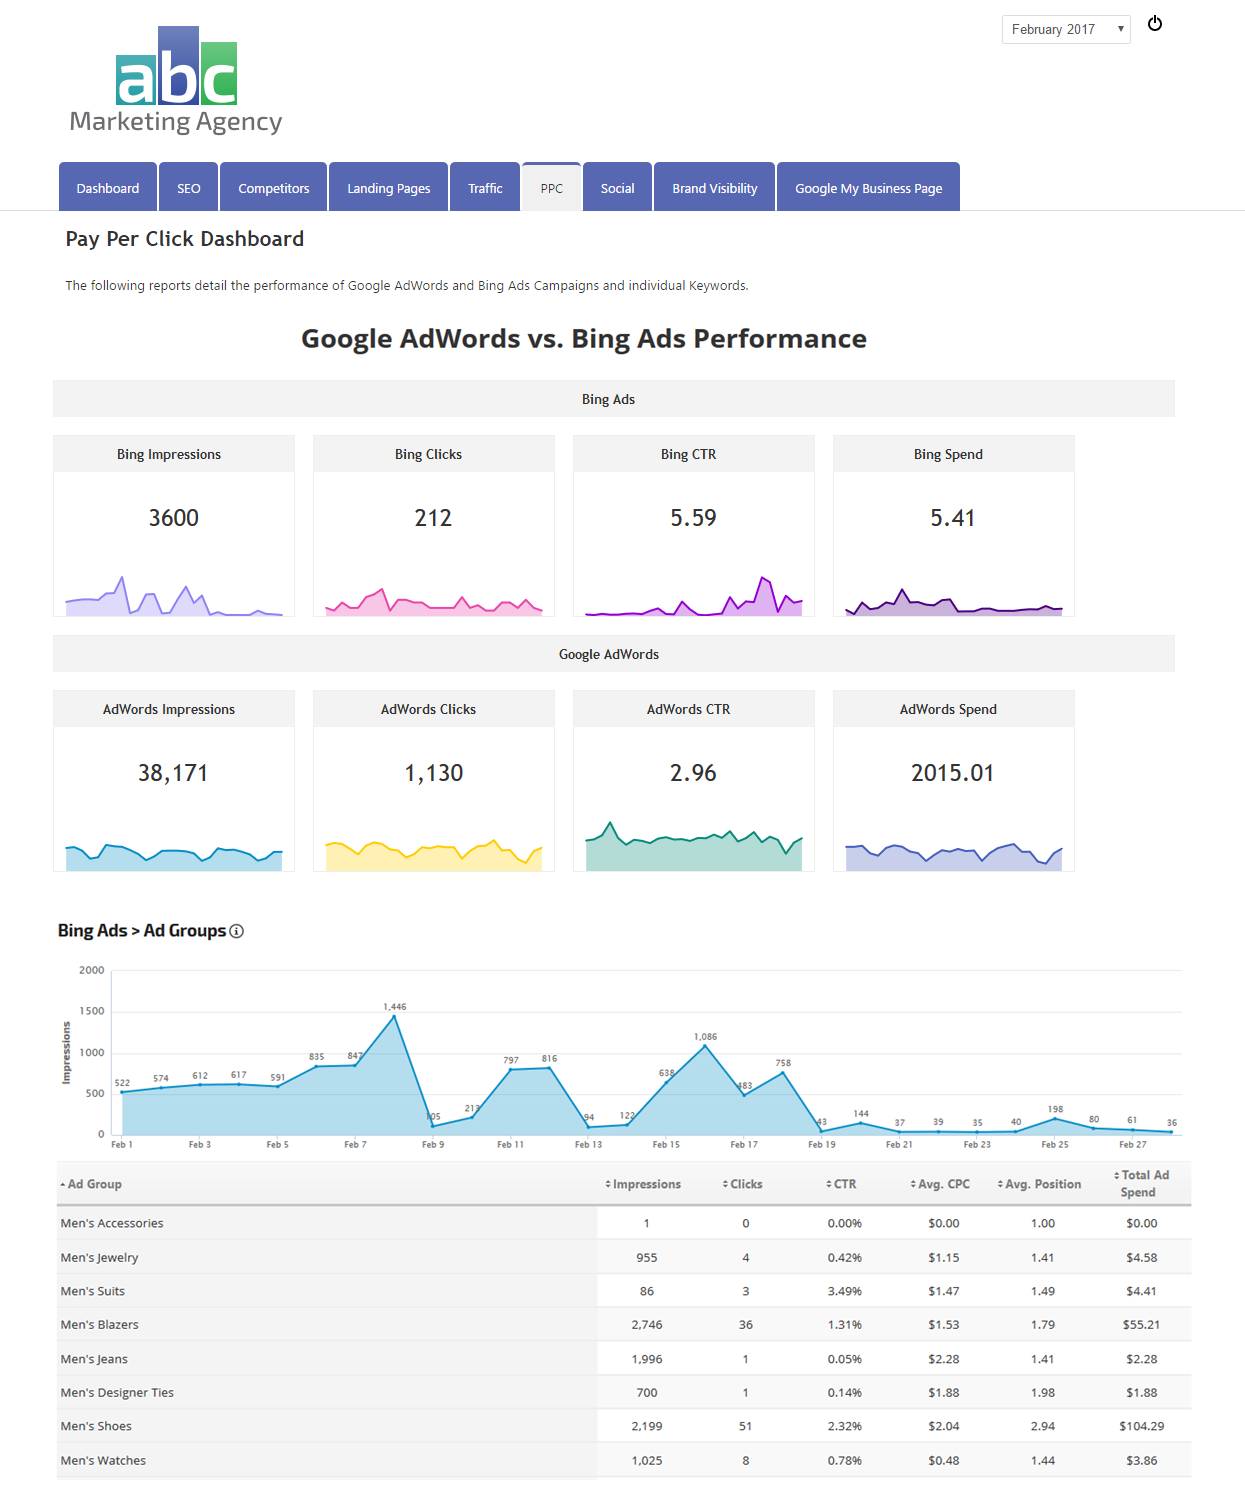
Bing Ads data, including a direct comparison to AdWords performance, as seen within the white label Marketing Dashboard
Unique PPC Data Comparisons – Bing It On!
If you’re looking to consolidate your PPC reporting, and if you’re looking to get unique comparative insights, then our Bing Ads integration is for you. Having all of your PPC data in one place is significant. Being able to create blended metric graphs that directly compare your Bing Ads and AdWords performance, allowing you to obtain unique insights not found anywhere else on the market for more informed decisions, is invaluable. Top it off with the ability to share the Bing and AdWords PPC reports within multiple white label reports, including the ever-versatile and totally white label Marketing Dashboard, and you’ve got yourself a piece of PPC management heaven right there!


